The twelve reports
Overview, customers, retention, revenue, packages, sessions, bookings, classes, instructors, schedule, branches and profit — what each one answers and when to open it.
Analytics holds twelve reports, in the side menu under Analytics and behind Open Analytics on Home. Each takes a date range — 7 days, 30, 90, 12 months or custom — and, with several locations, a branch. The range and branch sit in the address, so any view can be sent as a link.
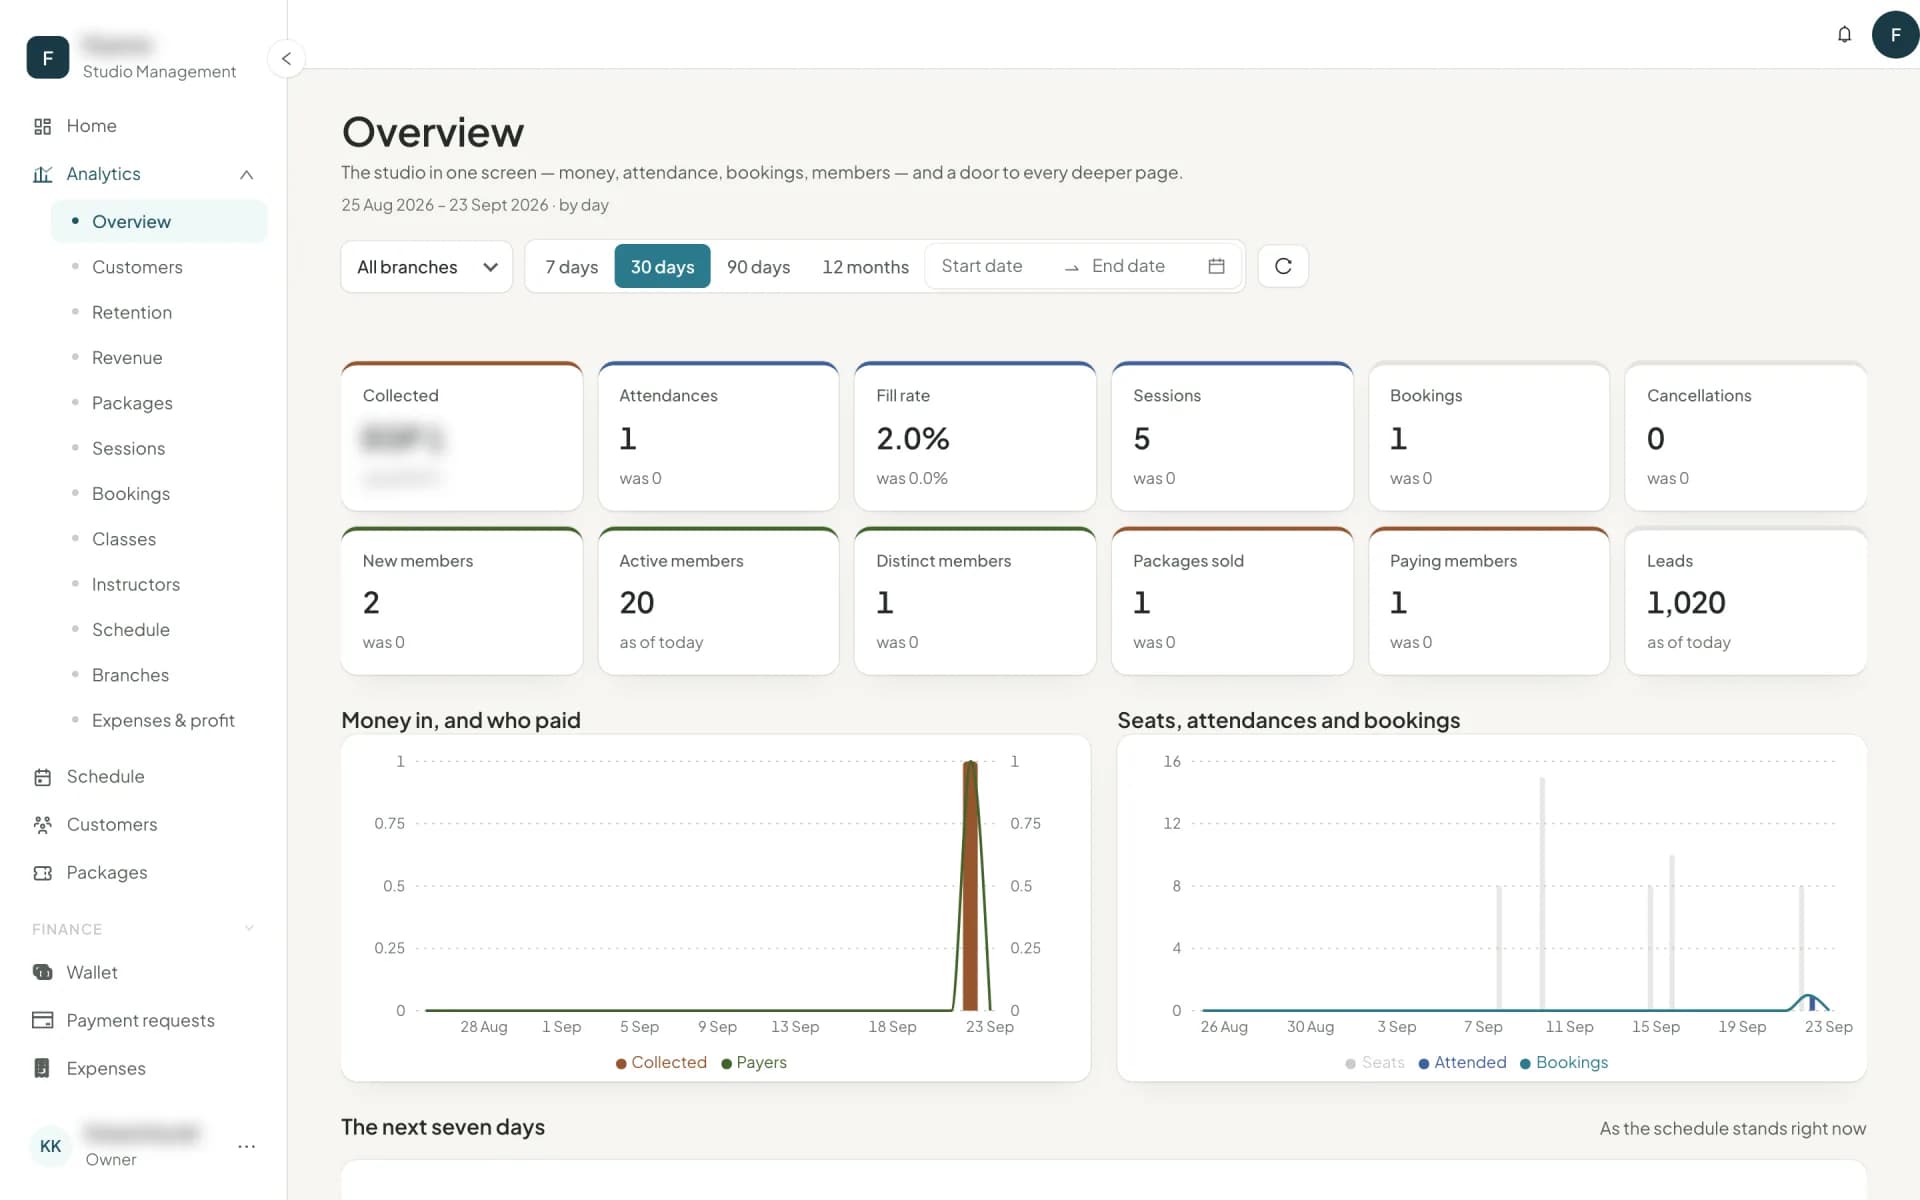
Every report opens with a strip of headline figures, each against the previous window of the same length (for figures where lower is better, a fall shows as good). Then a chart over time — by day, week or month, picked to suit the range — and tables that break the window down. Seeing the reports needs Analytics set to at least View in the person's role. Instructor cost and everything built from it — margin, what a class leaves after pay, profit, wages paid, cost per attendance — also need Payroll → View (the owner always sees them); without it those columns and cards are left out and the report says so in one line.
The twelve
| Report | Answers |
|---|---|
| Overview | The studio in one screen — money, attendance, bookings, customers, and the next seven days. |
| Customers | Who the customers are, where they came from, how often they come, who is worth most — with the customer risk table underneath. |
| Retention | Who keeps coming, who renews, who comes back — a new customer's first six months, and the cohorts. |
| Revenue | What came in, from whom, for what, how it was paid, when — plus the 30-day forecast and this month against the same days last month. |
| Packages | What sells, what gets used, what expires unused, what gets bought again. |
| Classes & spots | Supply and demand — how many classes, how full, how many empty. |
| Bookings | How customers book: how far ahead, through what channel, and how they cancel. |
| Classes | Every class family side by side: fill, loyalty, first-timers, money in, instructor cost out. |
| Instructors | Every instructor side by side: hours, fill, customers who come back to them, what they earn the studio. |
| Schedule | Where the timetable is full and where it is empty — with class-slot and instructor performance underneath. |
| Branches | Every location side by side. |
| Expenses & profit | What went out against what came in — and what each class and instructor leaves after pay. |
The five that change decisions
Retention
The renewal chart — packages that ended in each period and how many were renewed within 30 days, with a line for those that ended with unused classes. Underneath, the first-six-months curve: of the customers whose first visit was in this window, how many were seen again in each following 30-day period.
That curve is the single most useful chart in the product. If it falls off a cliff in month one, your problem is onboarding, not marketing.
Schedule
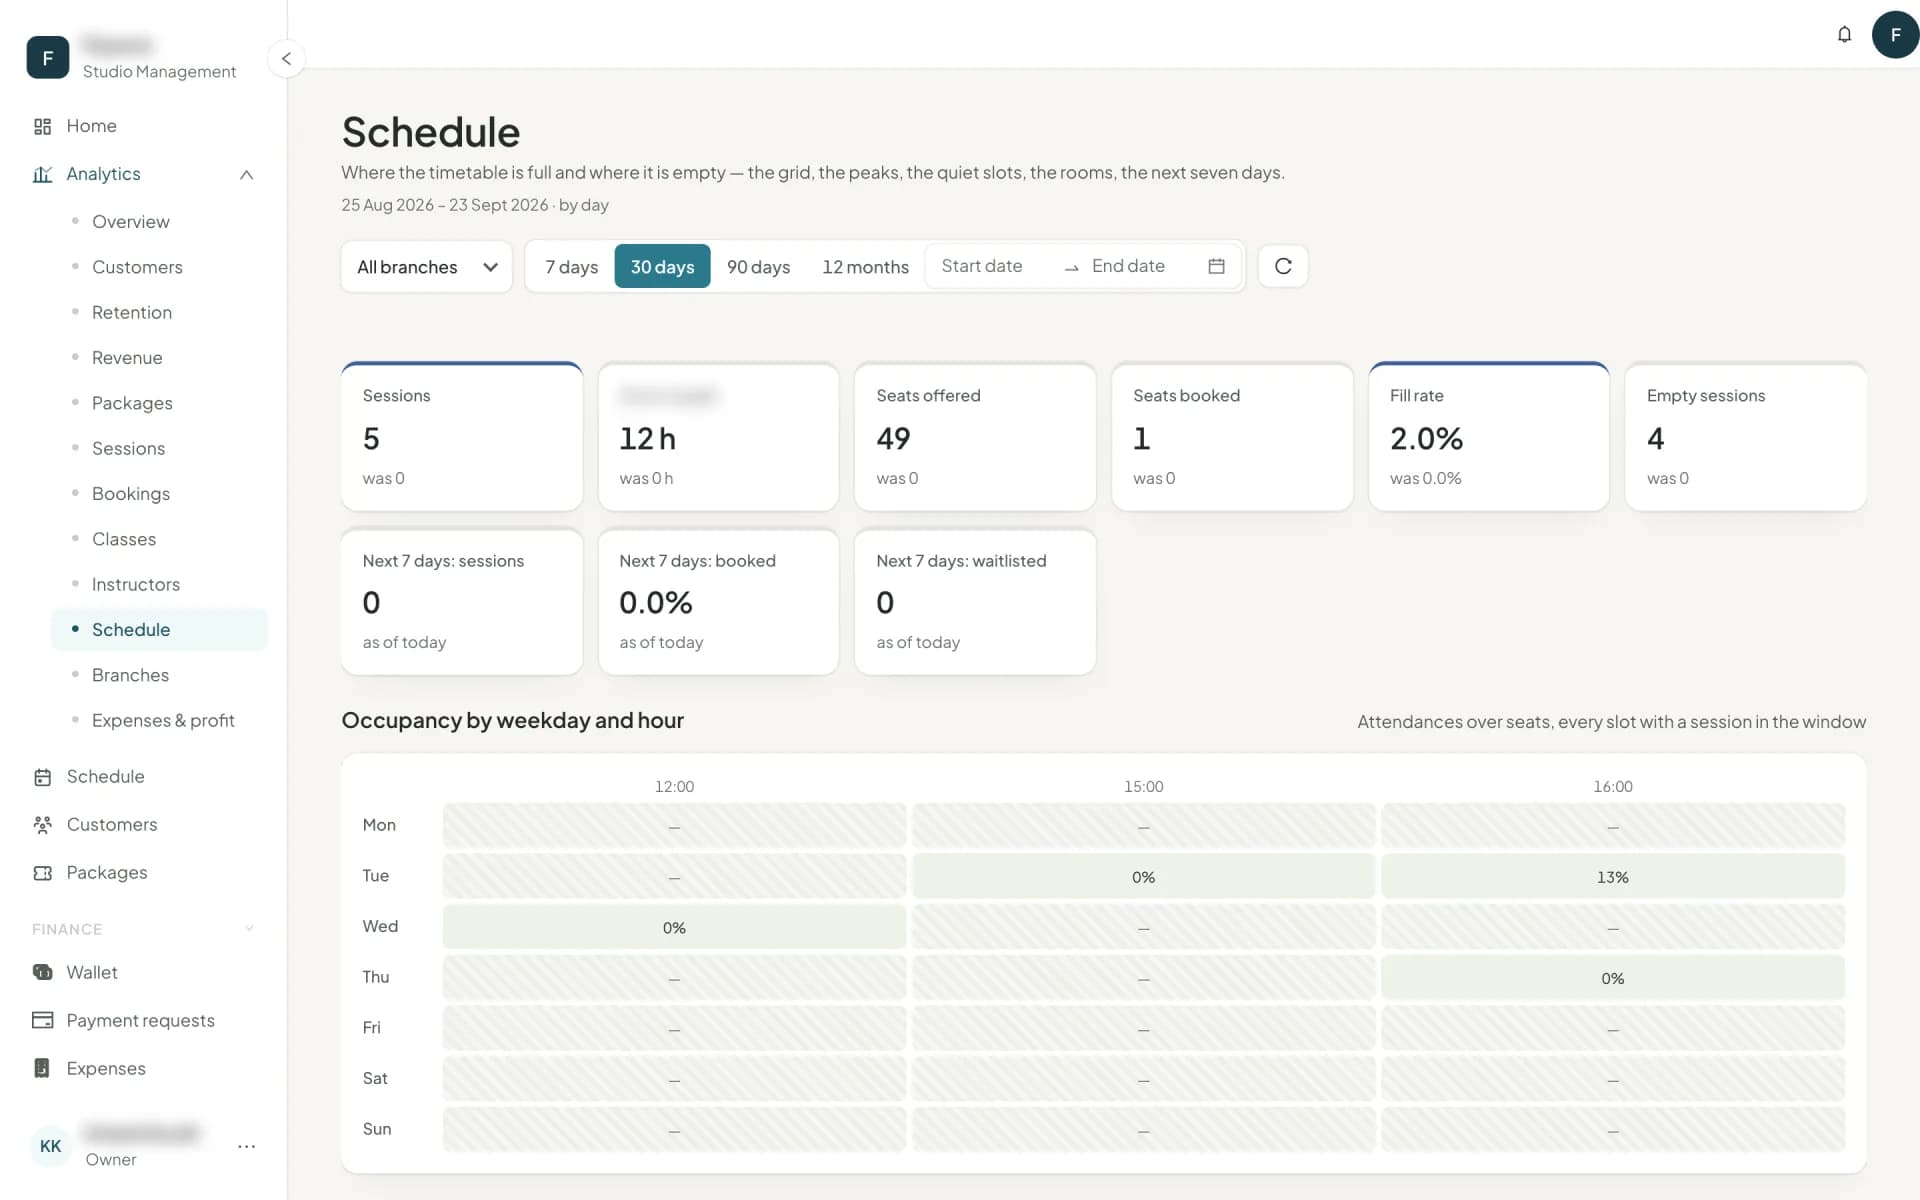
An occupancy heatmap by weekday and hour, plus busiest slots and quietest slots — the latter explicitly labelled as candidates to move or merge. This is the report that rebuilds a timetable.
Classes and Instructors
Two league tables with the same columns, sorted by attendances: sessions, seats, fill (and fill in the previous window), came back (customers with 2+ attendances), first-timers (customers whose first ever visit was here), cancellations, empty sessions, waitlisted, earned from classes (the value of the classes attended, not cash), instructor cost and margin. The instructor table adds hours taught.
Came back is the one to read. A class with high attendance and low return is a class people try once. An instructor with high first-timers and high return is the person to build the timetable around — and the one to pay more before somebody else does.
Expenses & profit
Collected against expenses and payroll paid per period, expenses by category, then what each class and instructor earned, what they were paid and what was left — and where you're losing money, with the reason: mostly free attendees, too few people, or priced below what the session costs. A popular class that loses money is only visible here. Each class's instructor cost is the same figure payroll pays under the instructor's pay plan — a flat fee, a share of revenue, per attendee, per hour, or their share of a monthly salary — so the report and the payslip agree to the cent.
Cohorts
At the bottom of Retention: each sign-up month (the month of a customer's first package) as a row, the share still holding a package after 1, 2, 3… months as columns, over the last 12 or 24 months. Cohorts of fewer than 10 customers are greyed and left out of averages, and months that have not happened yet are dashes rather than zeros. Beside it, last month against the month before — MRR, active customers, monthly retention and revenue per customer.
It reads left to right for one month's loyalty, and top to bottom for whether you are getting better. "Customers who joined in March retained best: 62% after 6 months" is written out for you underneath.
Two distinctions that explain most confusion
Collected vs earned from classes. Collected is cash in the window. Earned from classes is the value of classes attended. Sell a 3-month package in January and you collect in January but earn it from classes until April.
Bookings vs attendances. A booking is an intention. An attendance is a check-in, or a booking on a class that has already started and was not cancelled — most studios do not check everyone in, so a no-show who never cancelled still counts. Fill rate and customer risk count attendances. On Classes & spots, Booked → attended compares the two; on Bookings, Checked in shows how many past bookings were actually checked in. On the Classes and Instructors pages, a customer no-show is a booking that was not cancelled and not checked in, on a measured class that has ended. A class is measured when at least half of its bookings were checked in, leaving walk-ins aside, so one check-in in a class of ten does not make nine no-shows. The page tells you how much it could measure, as measured 3 of 15 classes, and a studio that never checks anyone in sees a dash, not a number. Late cancellations show beside them, by the same rule as Bookings. Nothing here is charged or shown to the customer, and it is separate from the instructor no-show in payroll.
Common questions
- What is the difference between collected and earned from classes?
- Collected is money received in the window. Earned from classes is the value of classes actually attended — the package price per class times attendances, not cash. A studio selling annual packages can collect a lot in January and earn it from classes all year.
- Does a booking count as attendance in these reports?
- Once the class has started, yes — unless it was cancelled. Most studios do not check every customer in, so an attendance is a check-in, or a booking on a class that has already started. Bookings on classes still to come are not attendances, and the Bookings report shows what share of past bookings were actually checked in.
Last updated 7 October 2026